top of page
Data Visualization
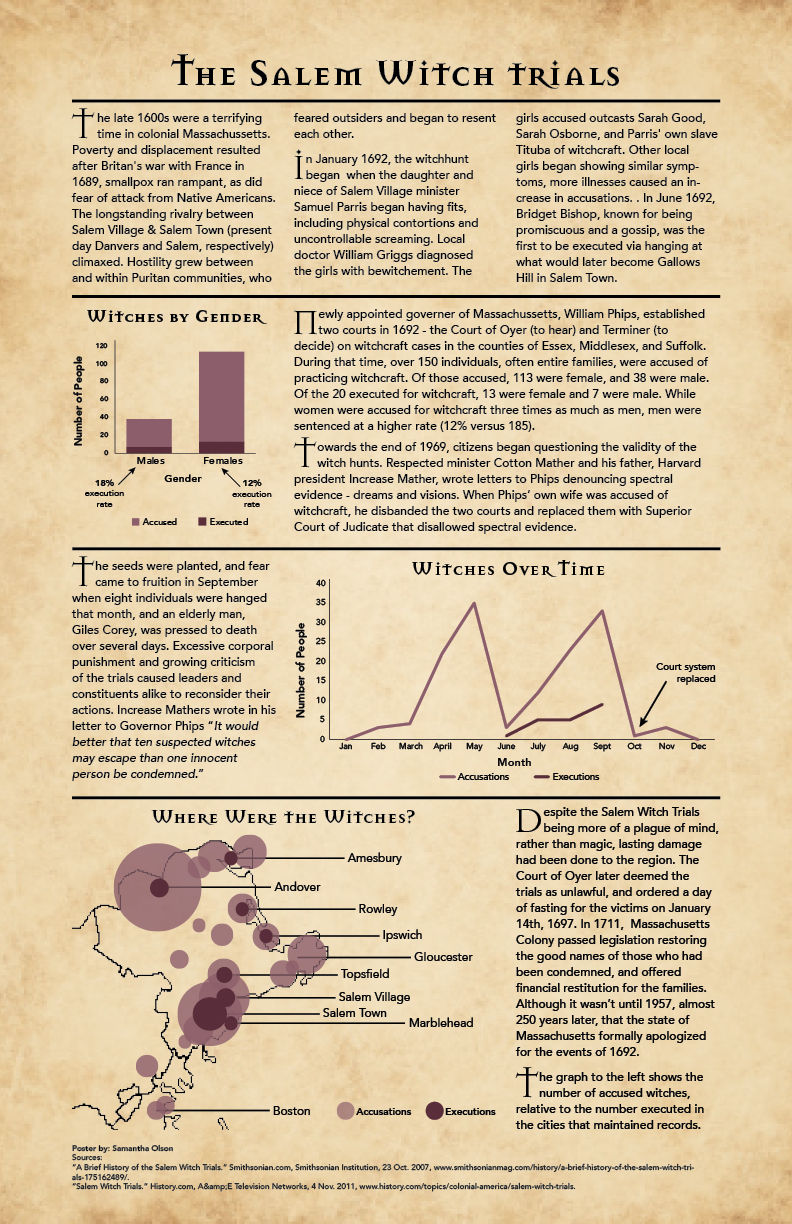
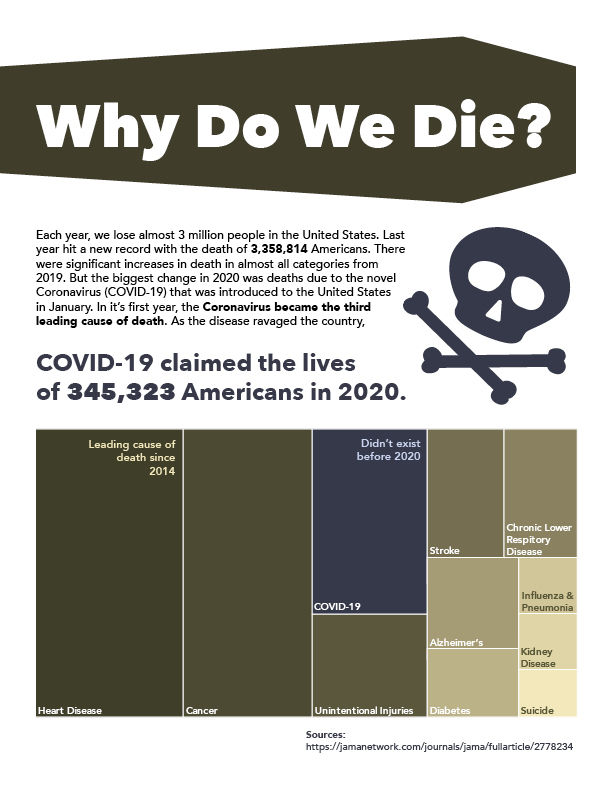
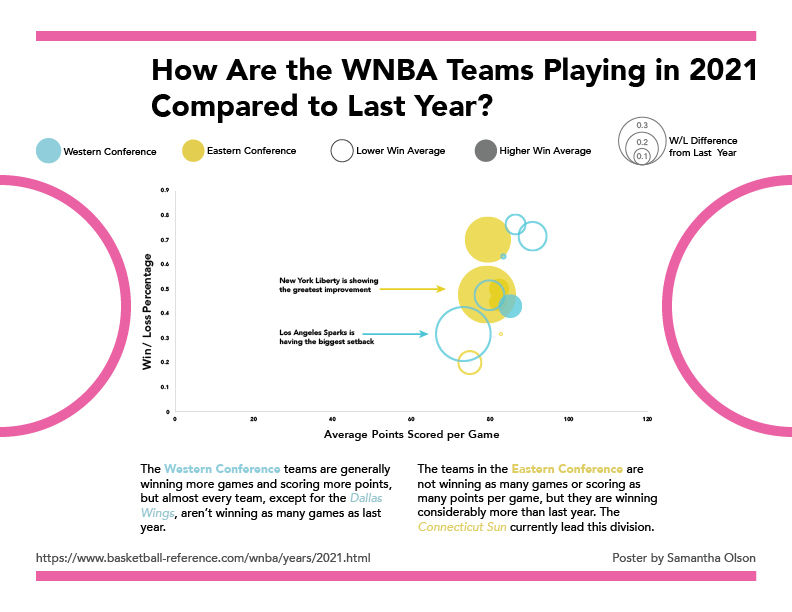
As a student, I felt the need to hide my love of statistics while my peers struggled with the subject. Now, I have fully embraced the beauty of statistics and have developed an affinity for drawing new meanings from data by expressing the relationship between numbers through visuals.


bottom of page
